

The Insights tab shows how a project is doing financially and how well it was planned. The Activity tab shows what changed.
Required rights: Admin or individual project rights
Insights
Open the project and switch to Insights. Under Selected period you choose the time frame, for example All time.
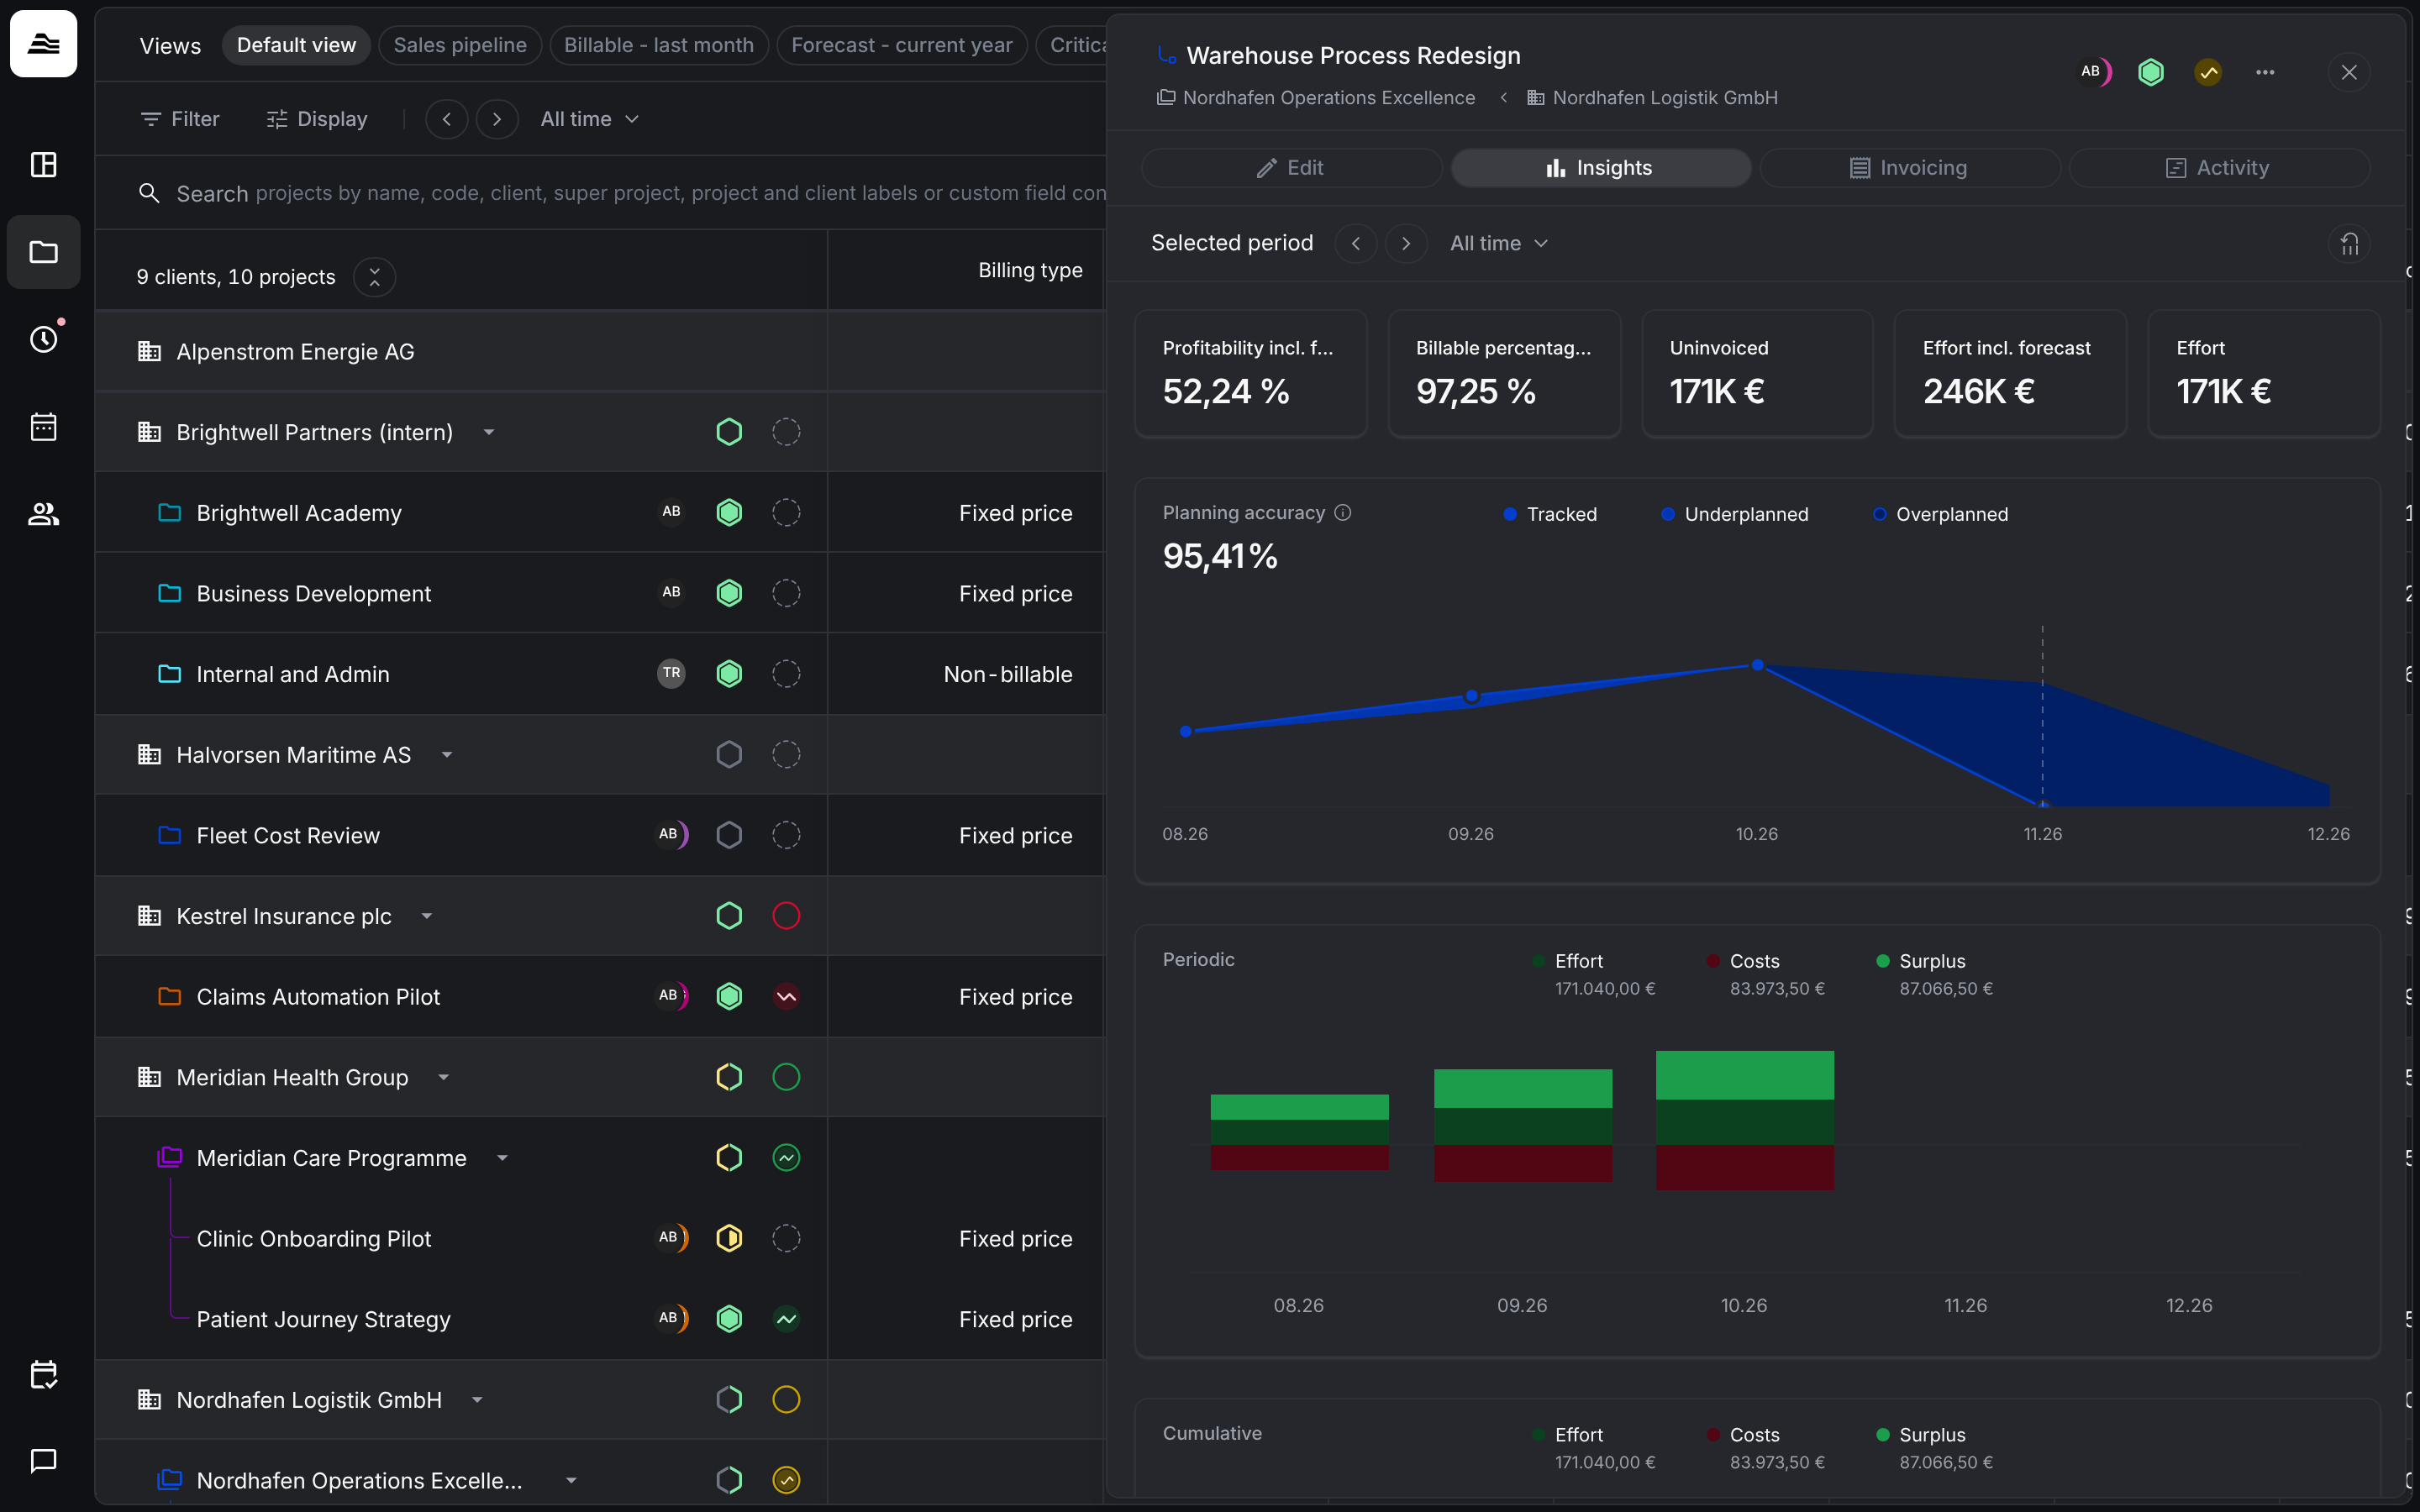
At the top you see the key figures of the project: Profitability incl. forecast, Billable percentage (%), Uninvoiced, Effort incl. forecast and Effort. The article on KPIs explains how each figure is calculated.
Planning accuracy compares planned hours with tracked hours on the project. The chart shows per month what was Tracked, Underplanned and Overplanned.
Effort, Costs and Surplus are shown twice: Periodic per month and Cumulative over time. Costs come from the rates in the employment data of each staff member.
At the bottom, the breakdown splits effort by Tasks, Staff or Teams, with percentage, amount and hours.
Activity
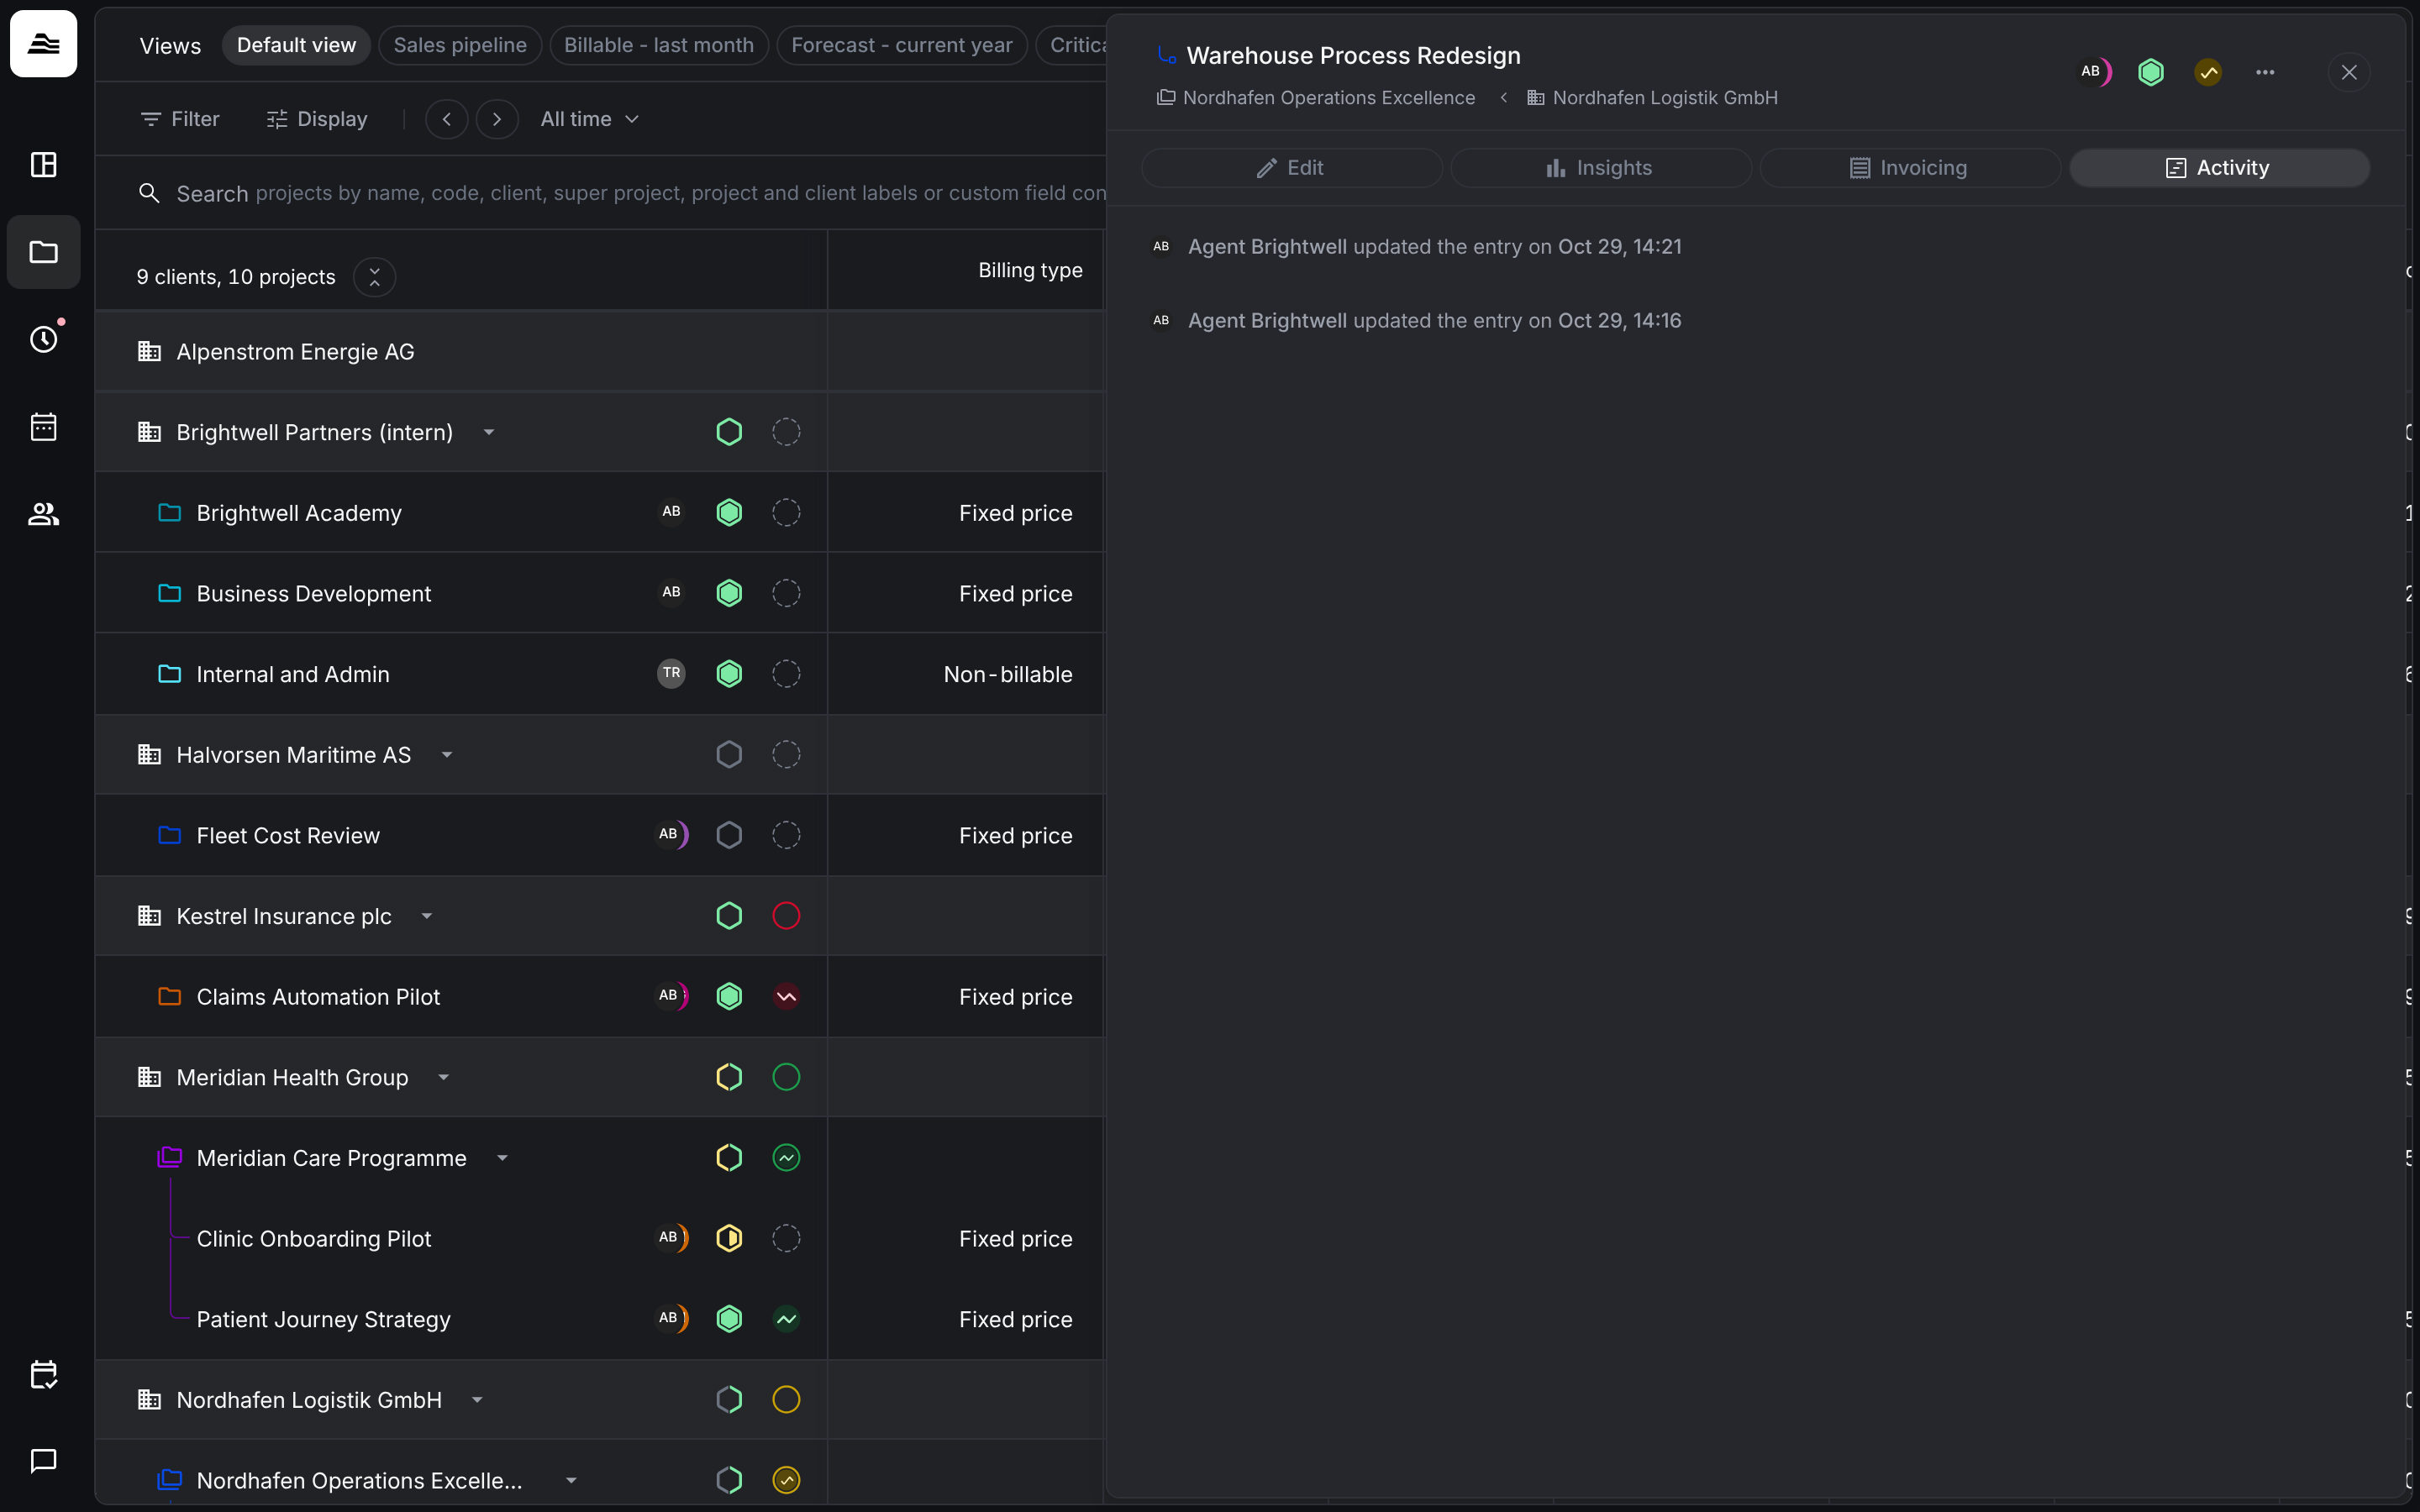
Switch to Activity to see the history of the project. It currently lists changes to time entries: who changed an entry and when.
Related
- Budget and hourly rates: the settings behind effort and forecast.
- Project approval: review the project's time entries.