
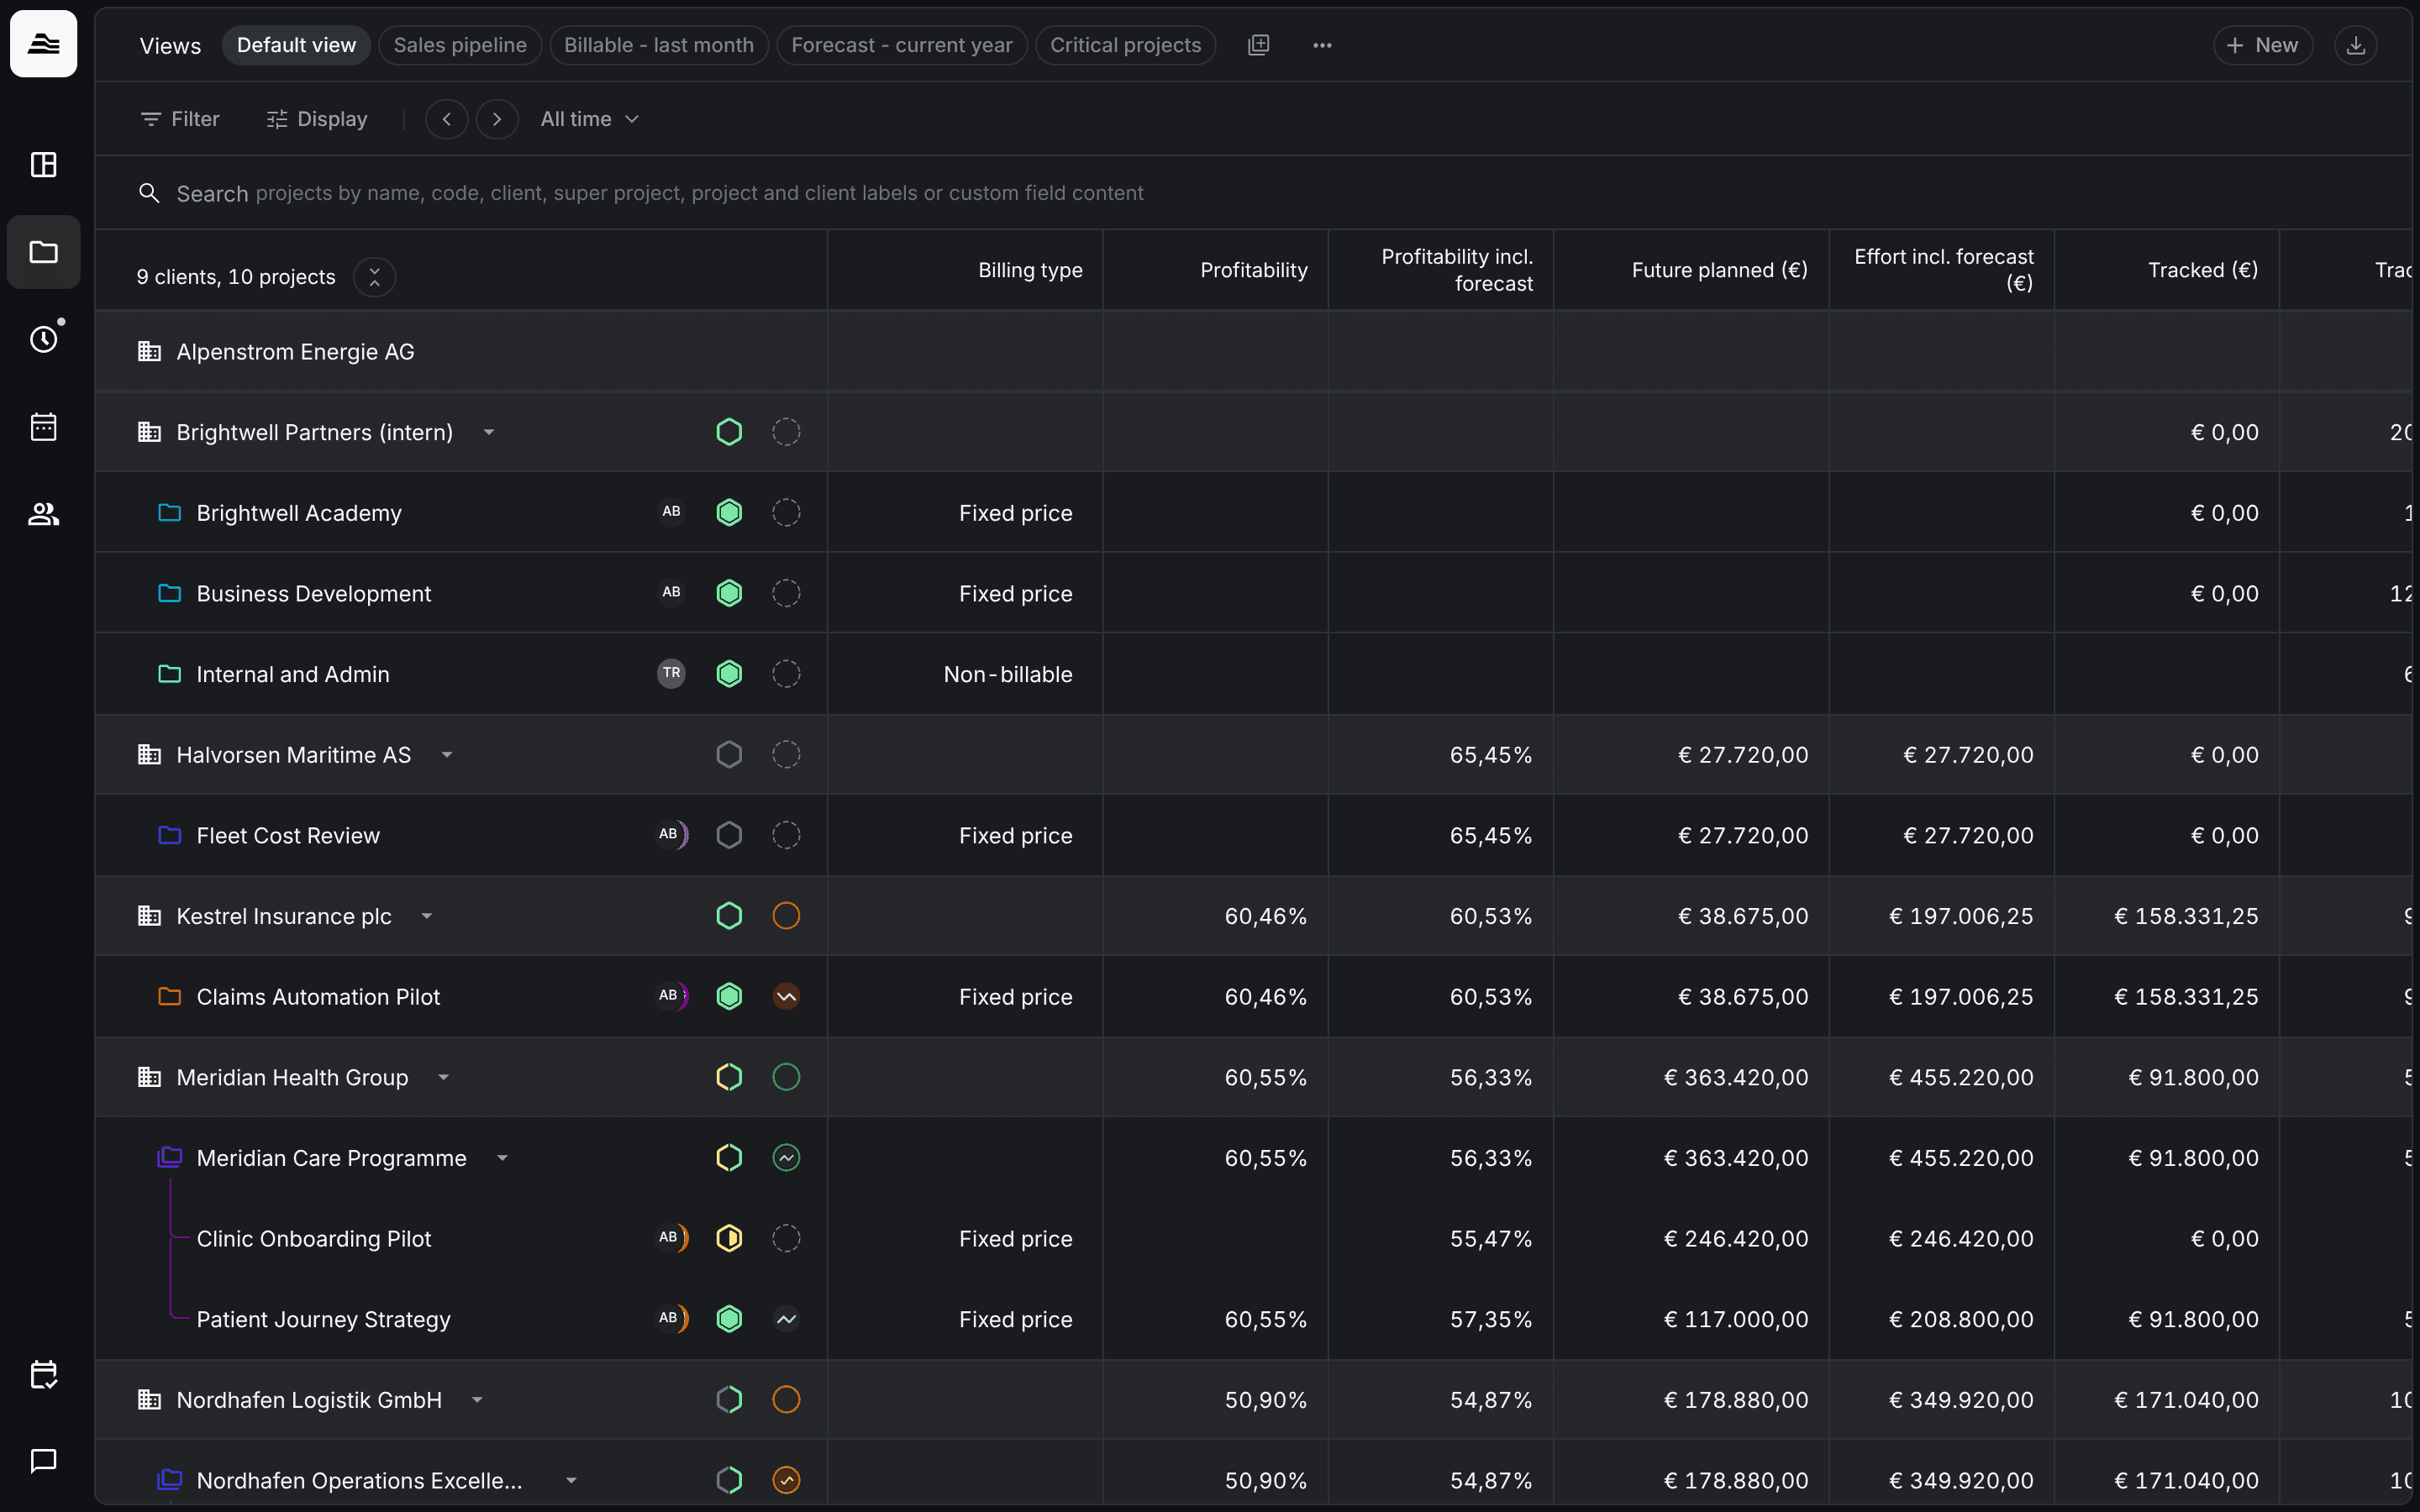
The Clients & projects board lists all clients with their projects and super projects in one table, with key figures for every row. This is where you find, filter and open projects.
Views
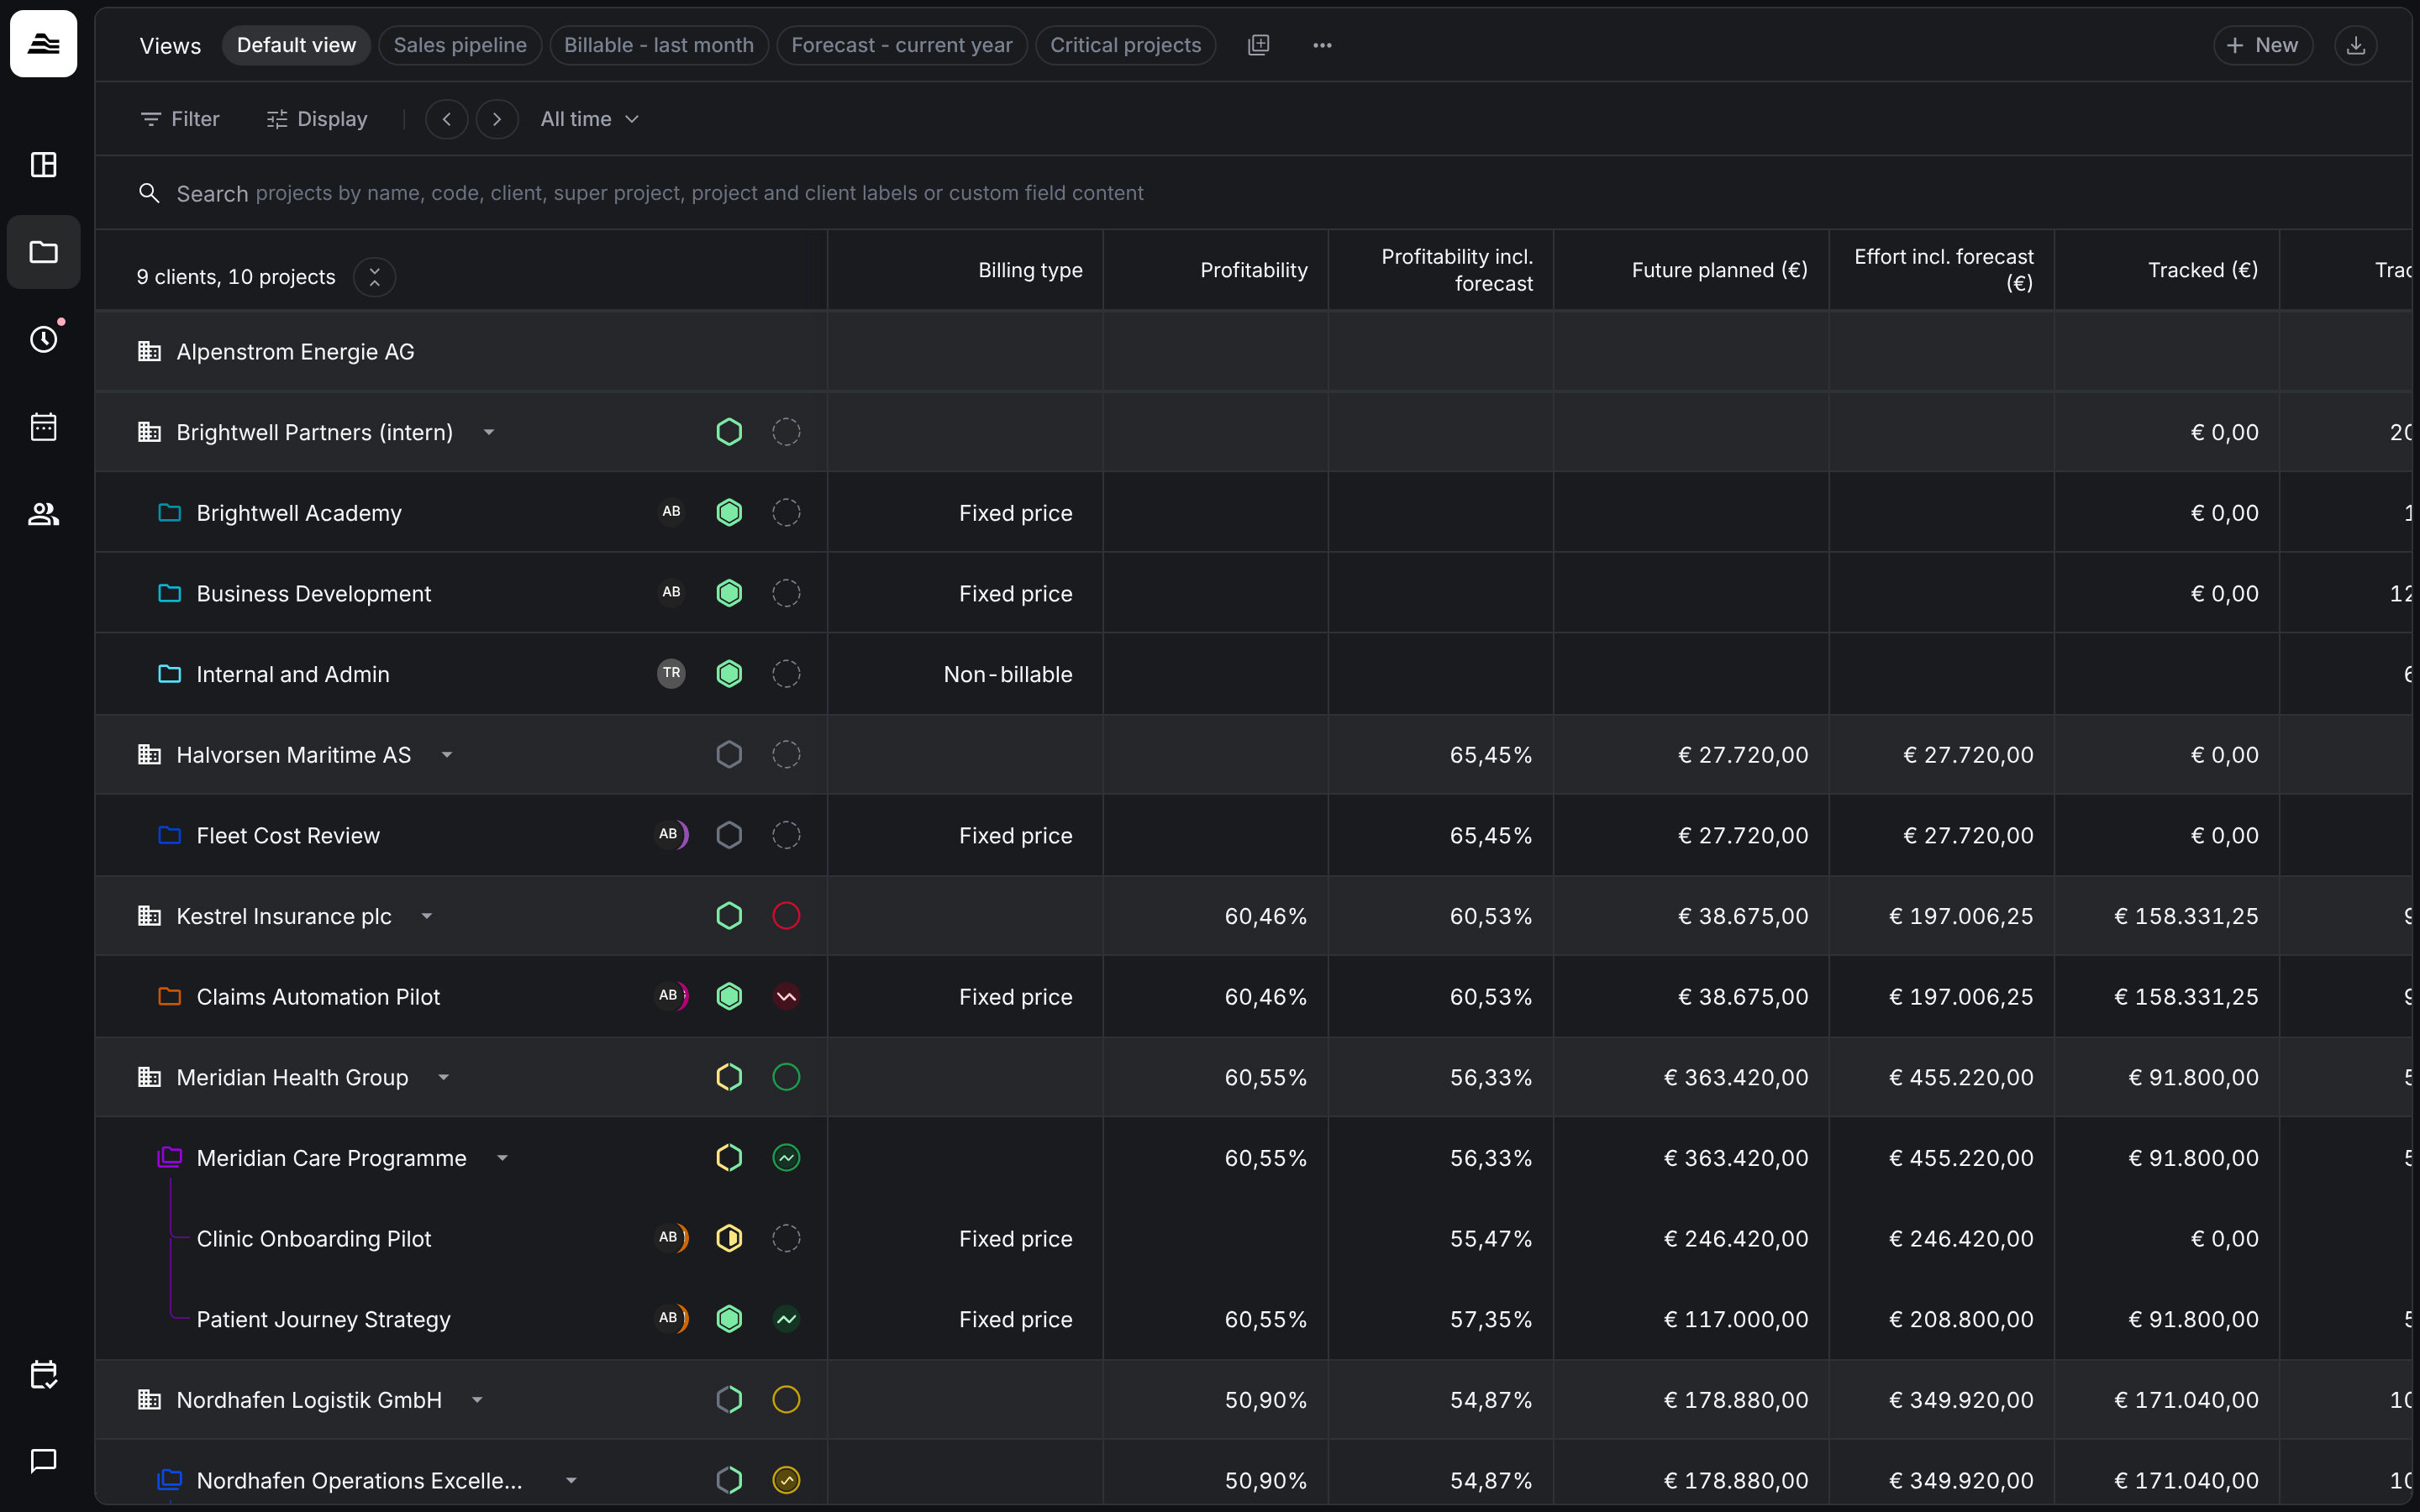
Views save a combination of filters, columns and display options. Everyone with access to the board gets the same set of views: Default view, Sales pipeline, Billable - last month, Forecast - current year and Critical projects.
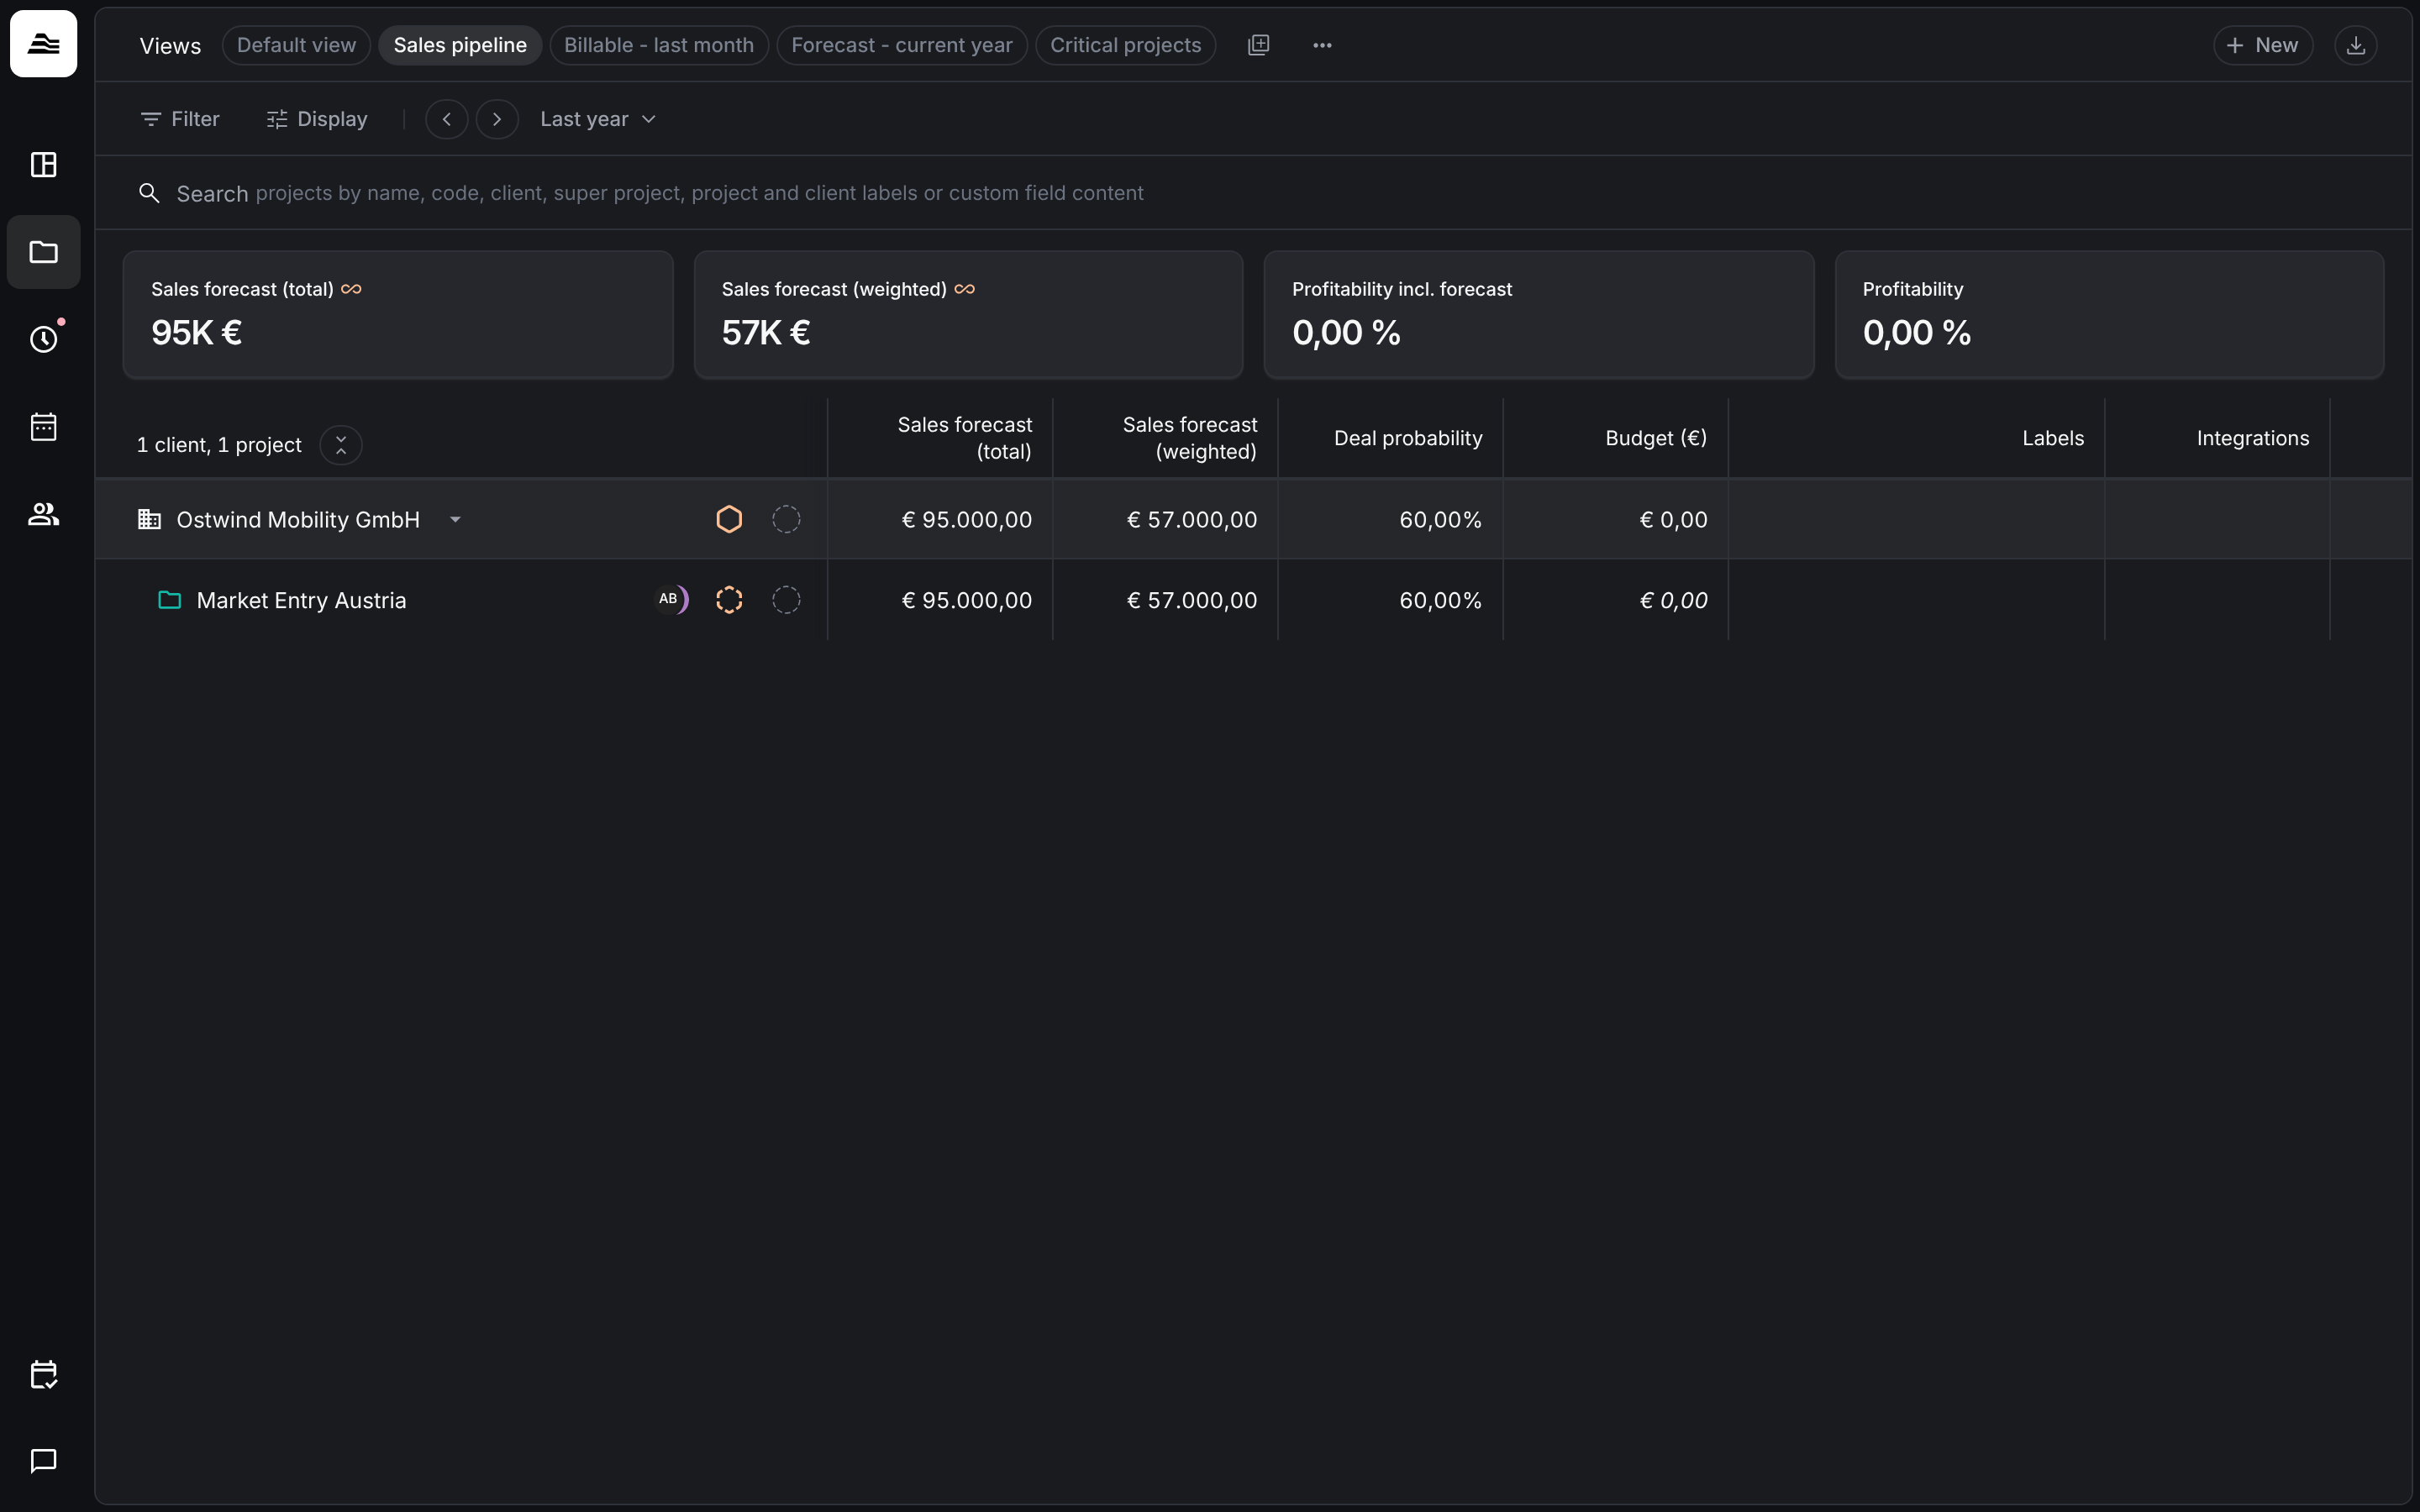
Sales pipeline, for example, shows your deals with their amount and probability.
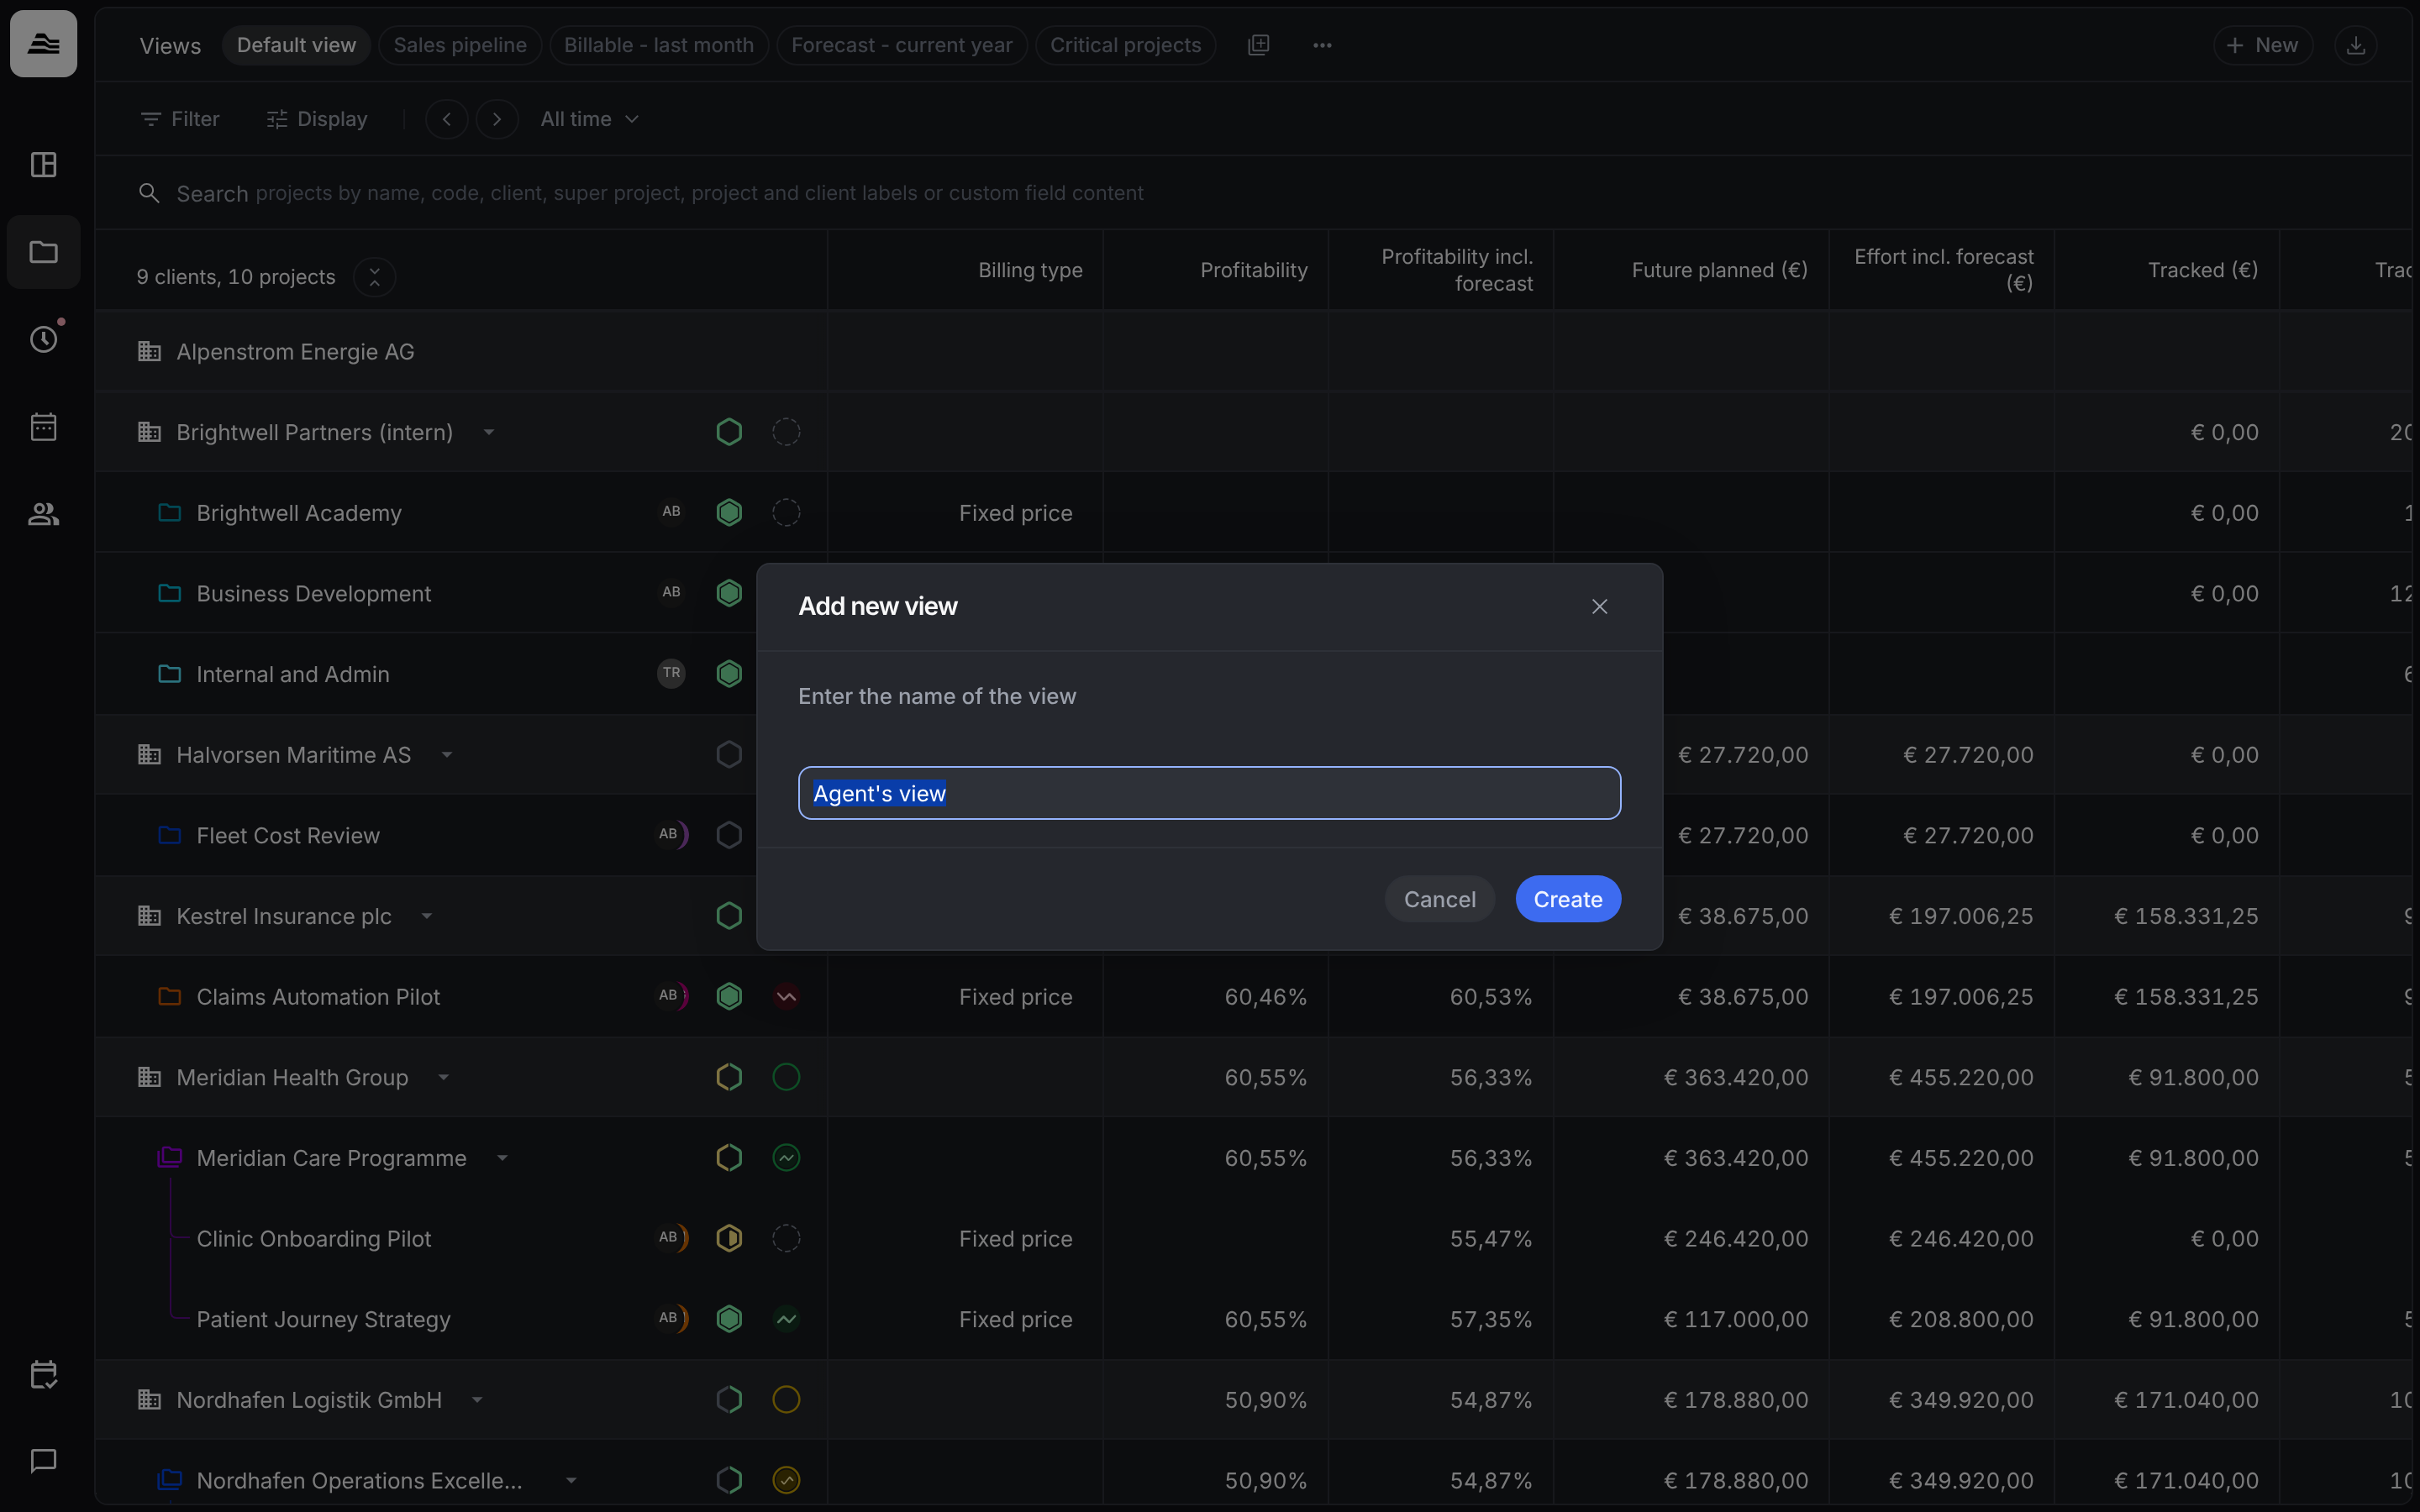
To save your own view, click the icon next to the views, enter a name in Add new view and click Create. Your own views are only visible to you and can't be shared. The … menu next to the views lets you reorder them.
Filter, search and period
- Filter narrows the list, for example to one client or one status.
- Search finds projects by name, code, client, super project, project and client labels or custom field content.
- All time sets the period for the figures. The arrows move it back and forward.
Display controls what the table shows: planning accuracy, KPIs, future projects, projects without effort, archived projects, clients without projects, and whether client folders collapse automatically. Under Row options you show or hide project lead, status and health.
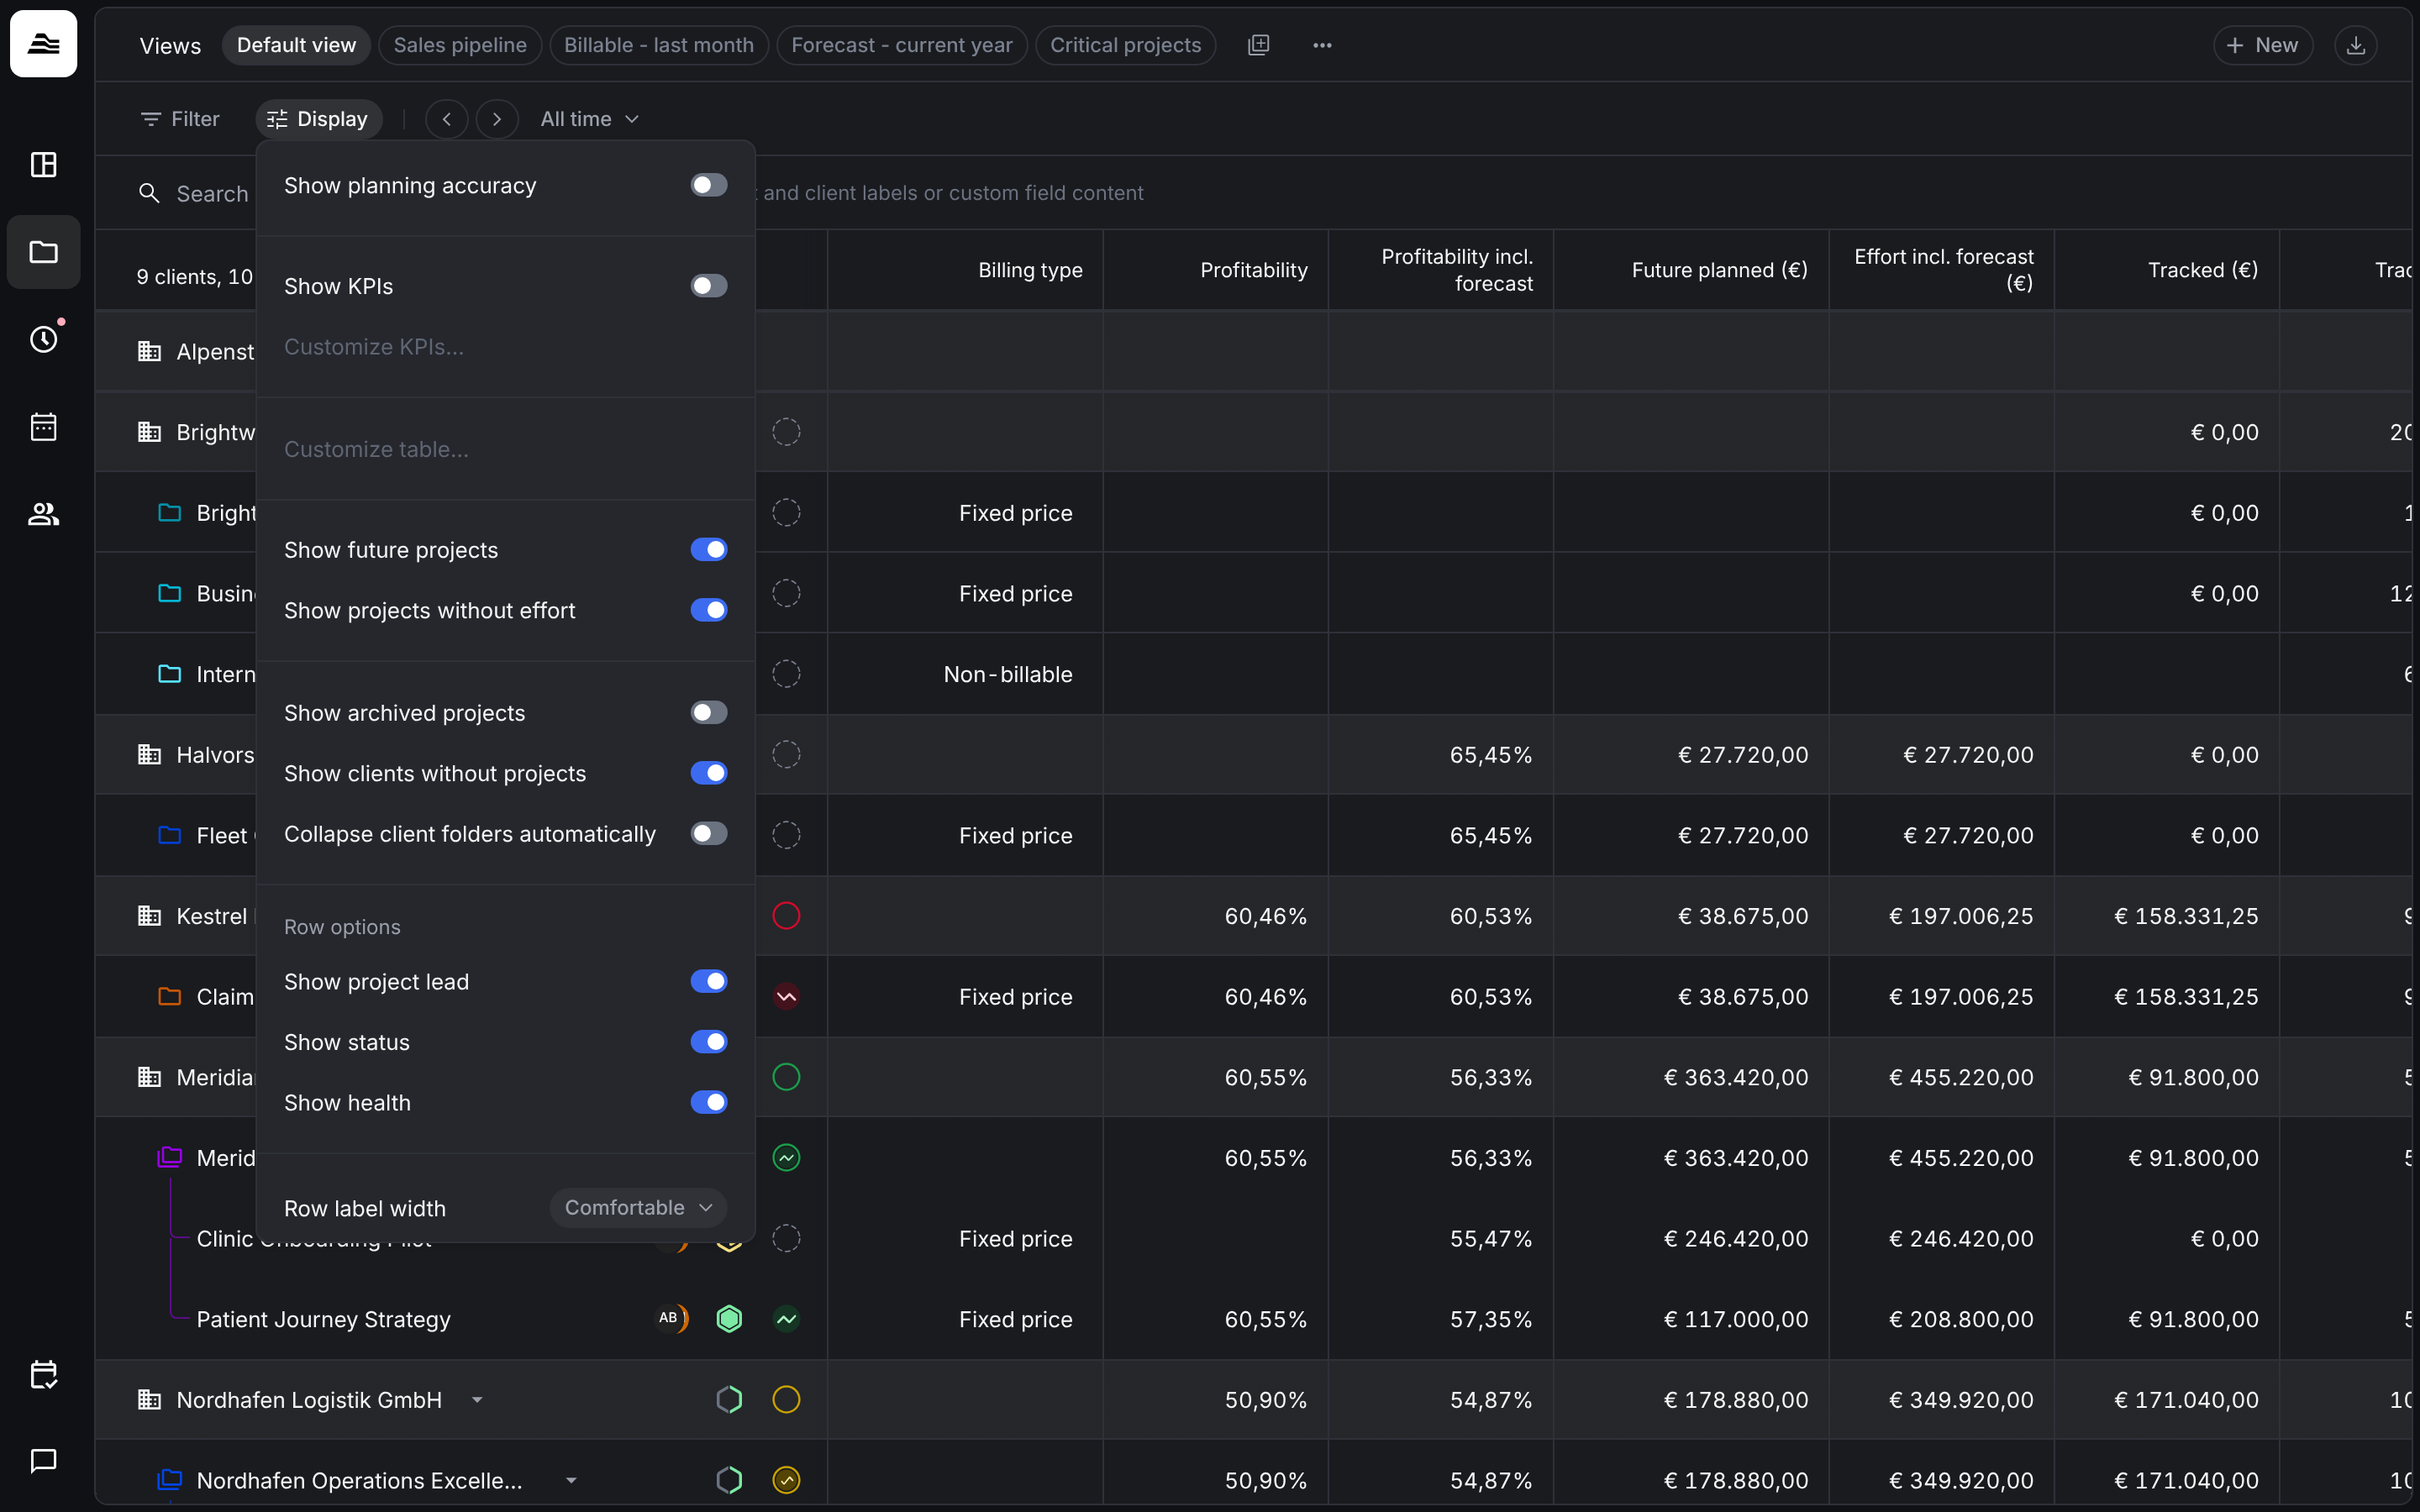
The figures in the columns, such as profitability or effort incl. forecast, are explained in the article on KPIs.
Read a row
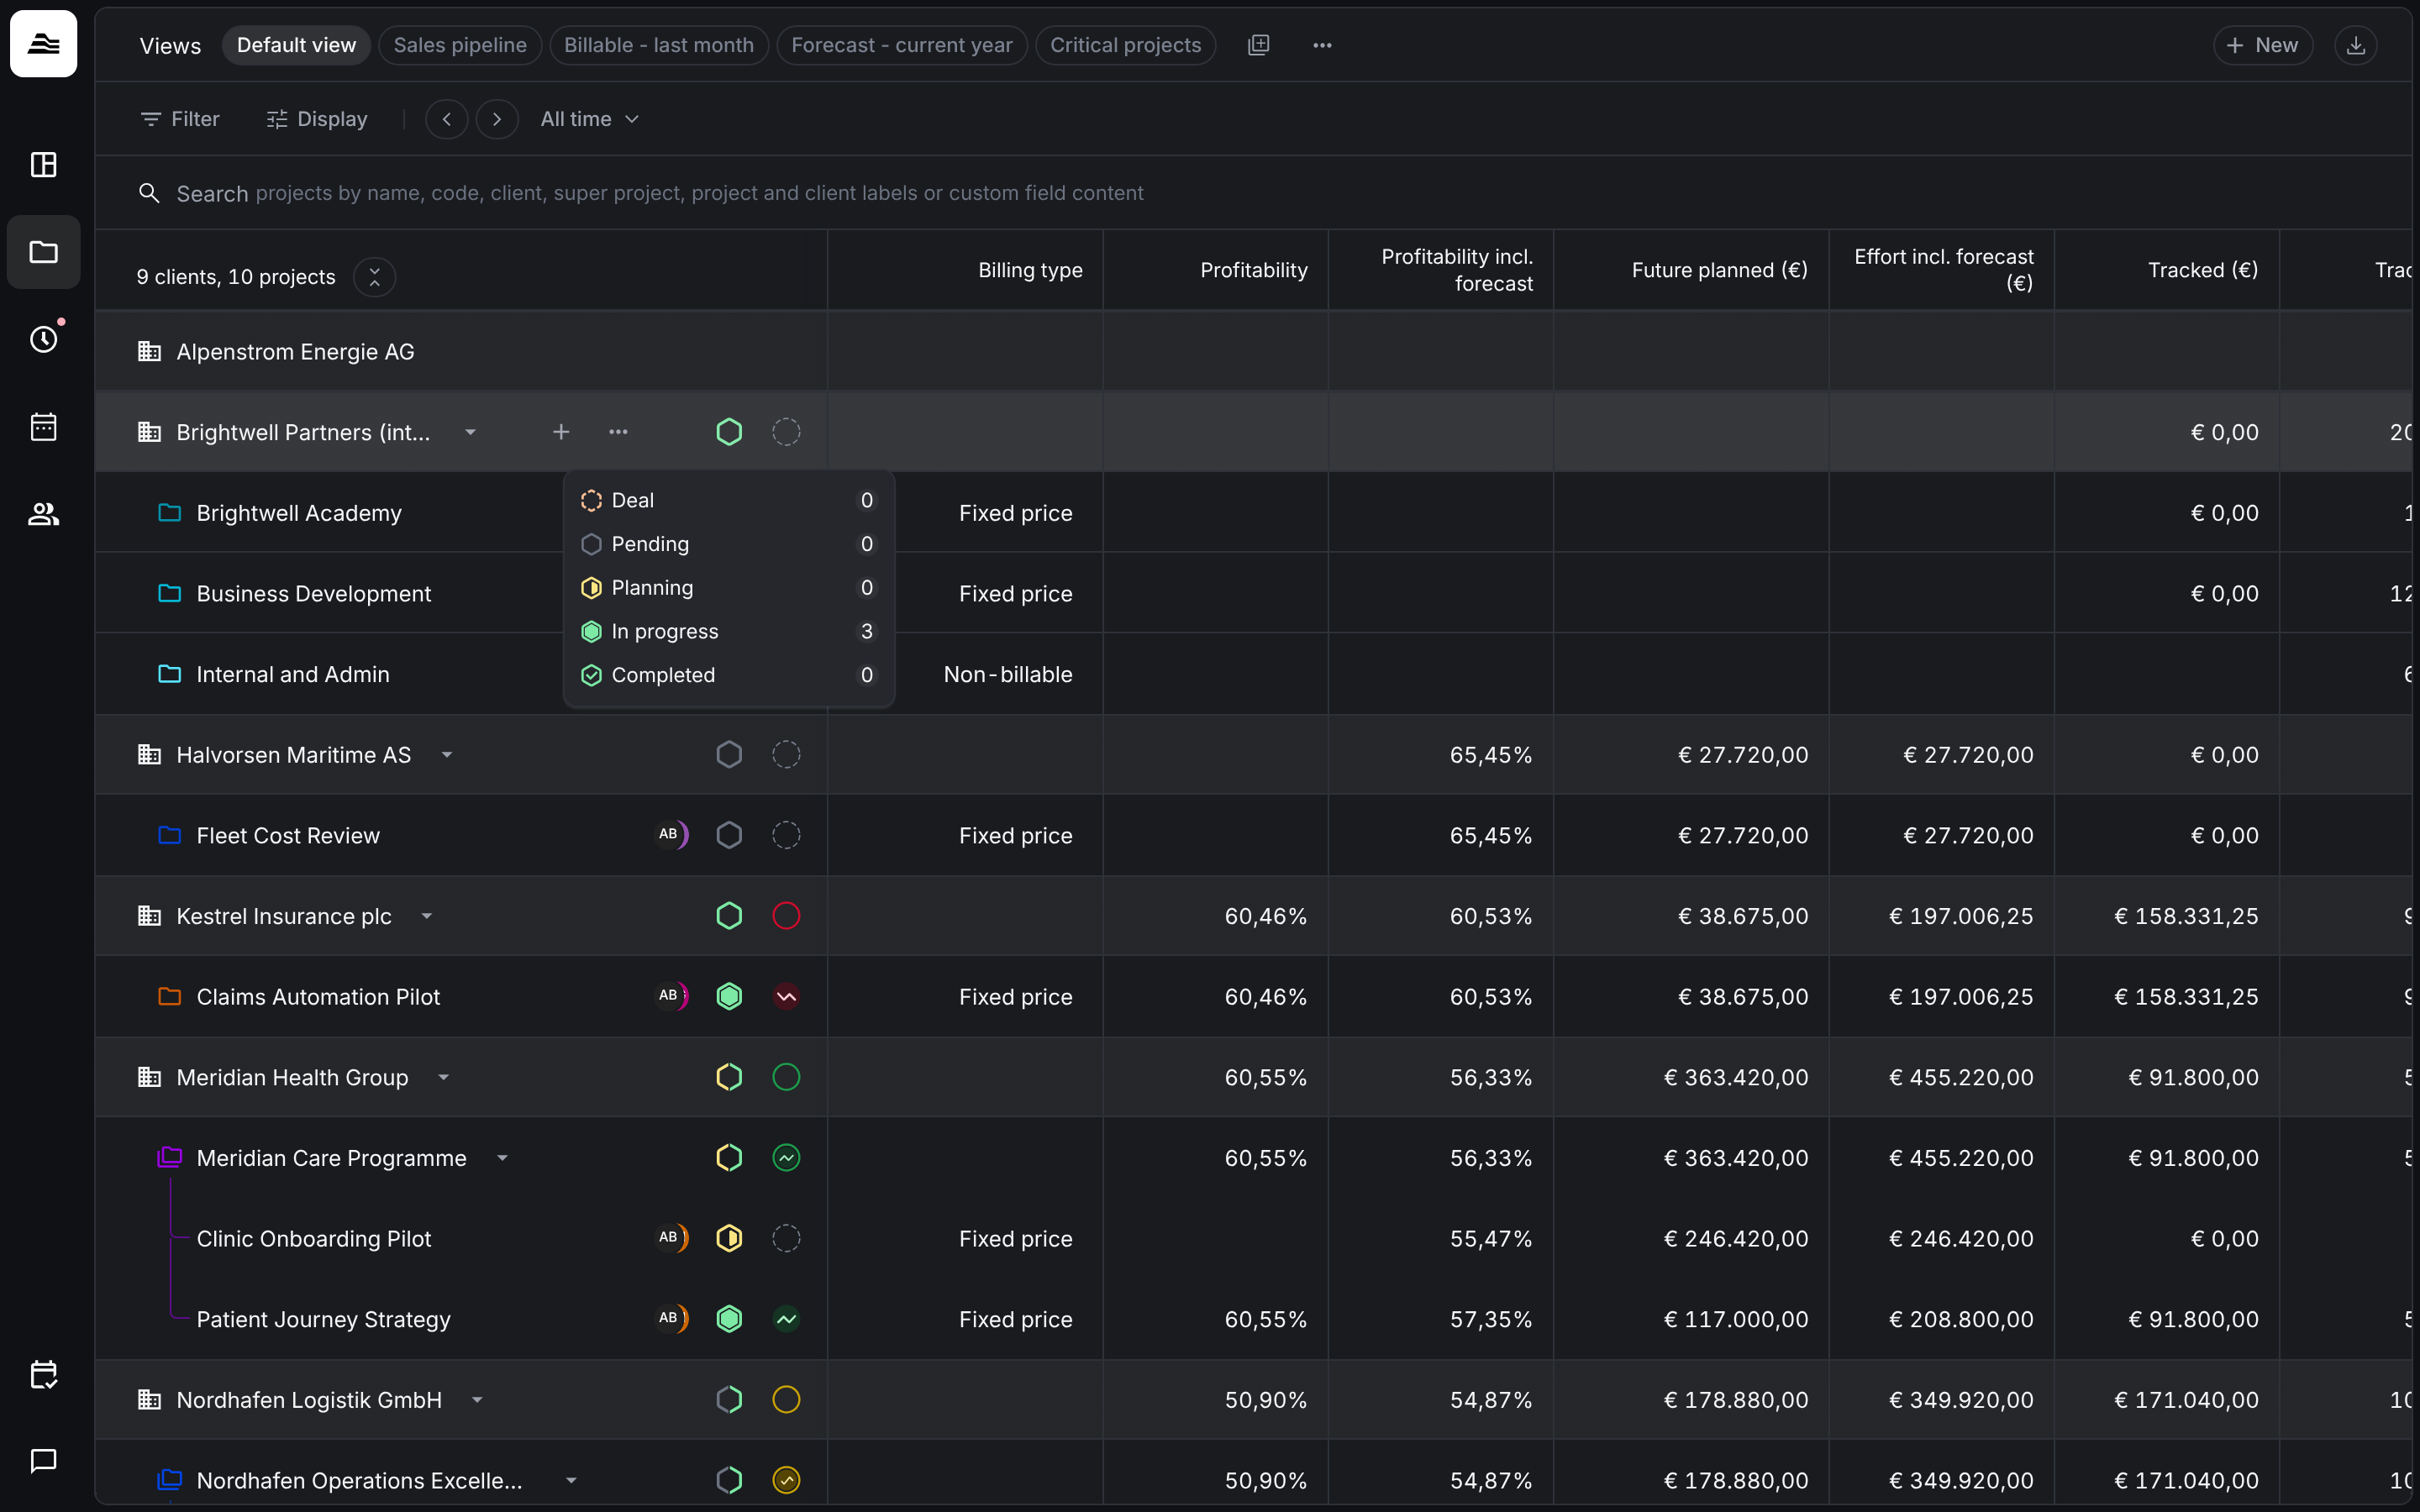
Each project row shows three markers next to its name:
- The avatar shows the project lead. Hover over it to see all project leads.
- The hexagon shows the project status.
- The circle shows the project health.
On a client row, hover over the status to see how many of the client's projects have each status.
Create clients and projects
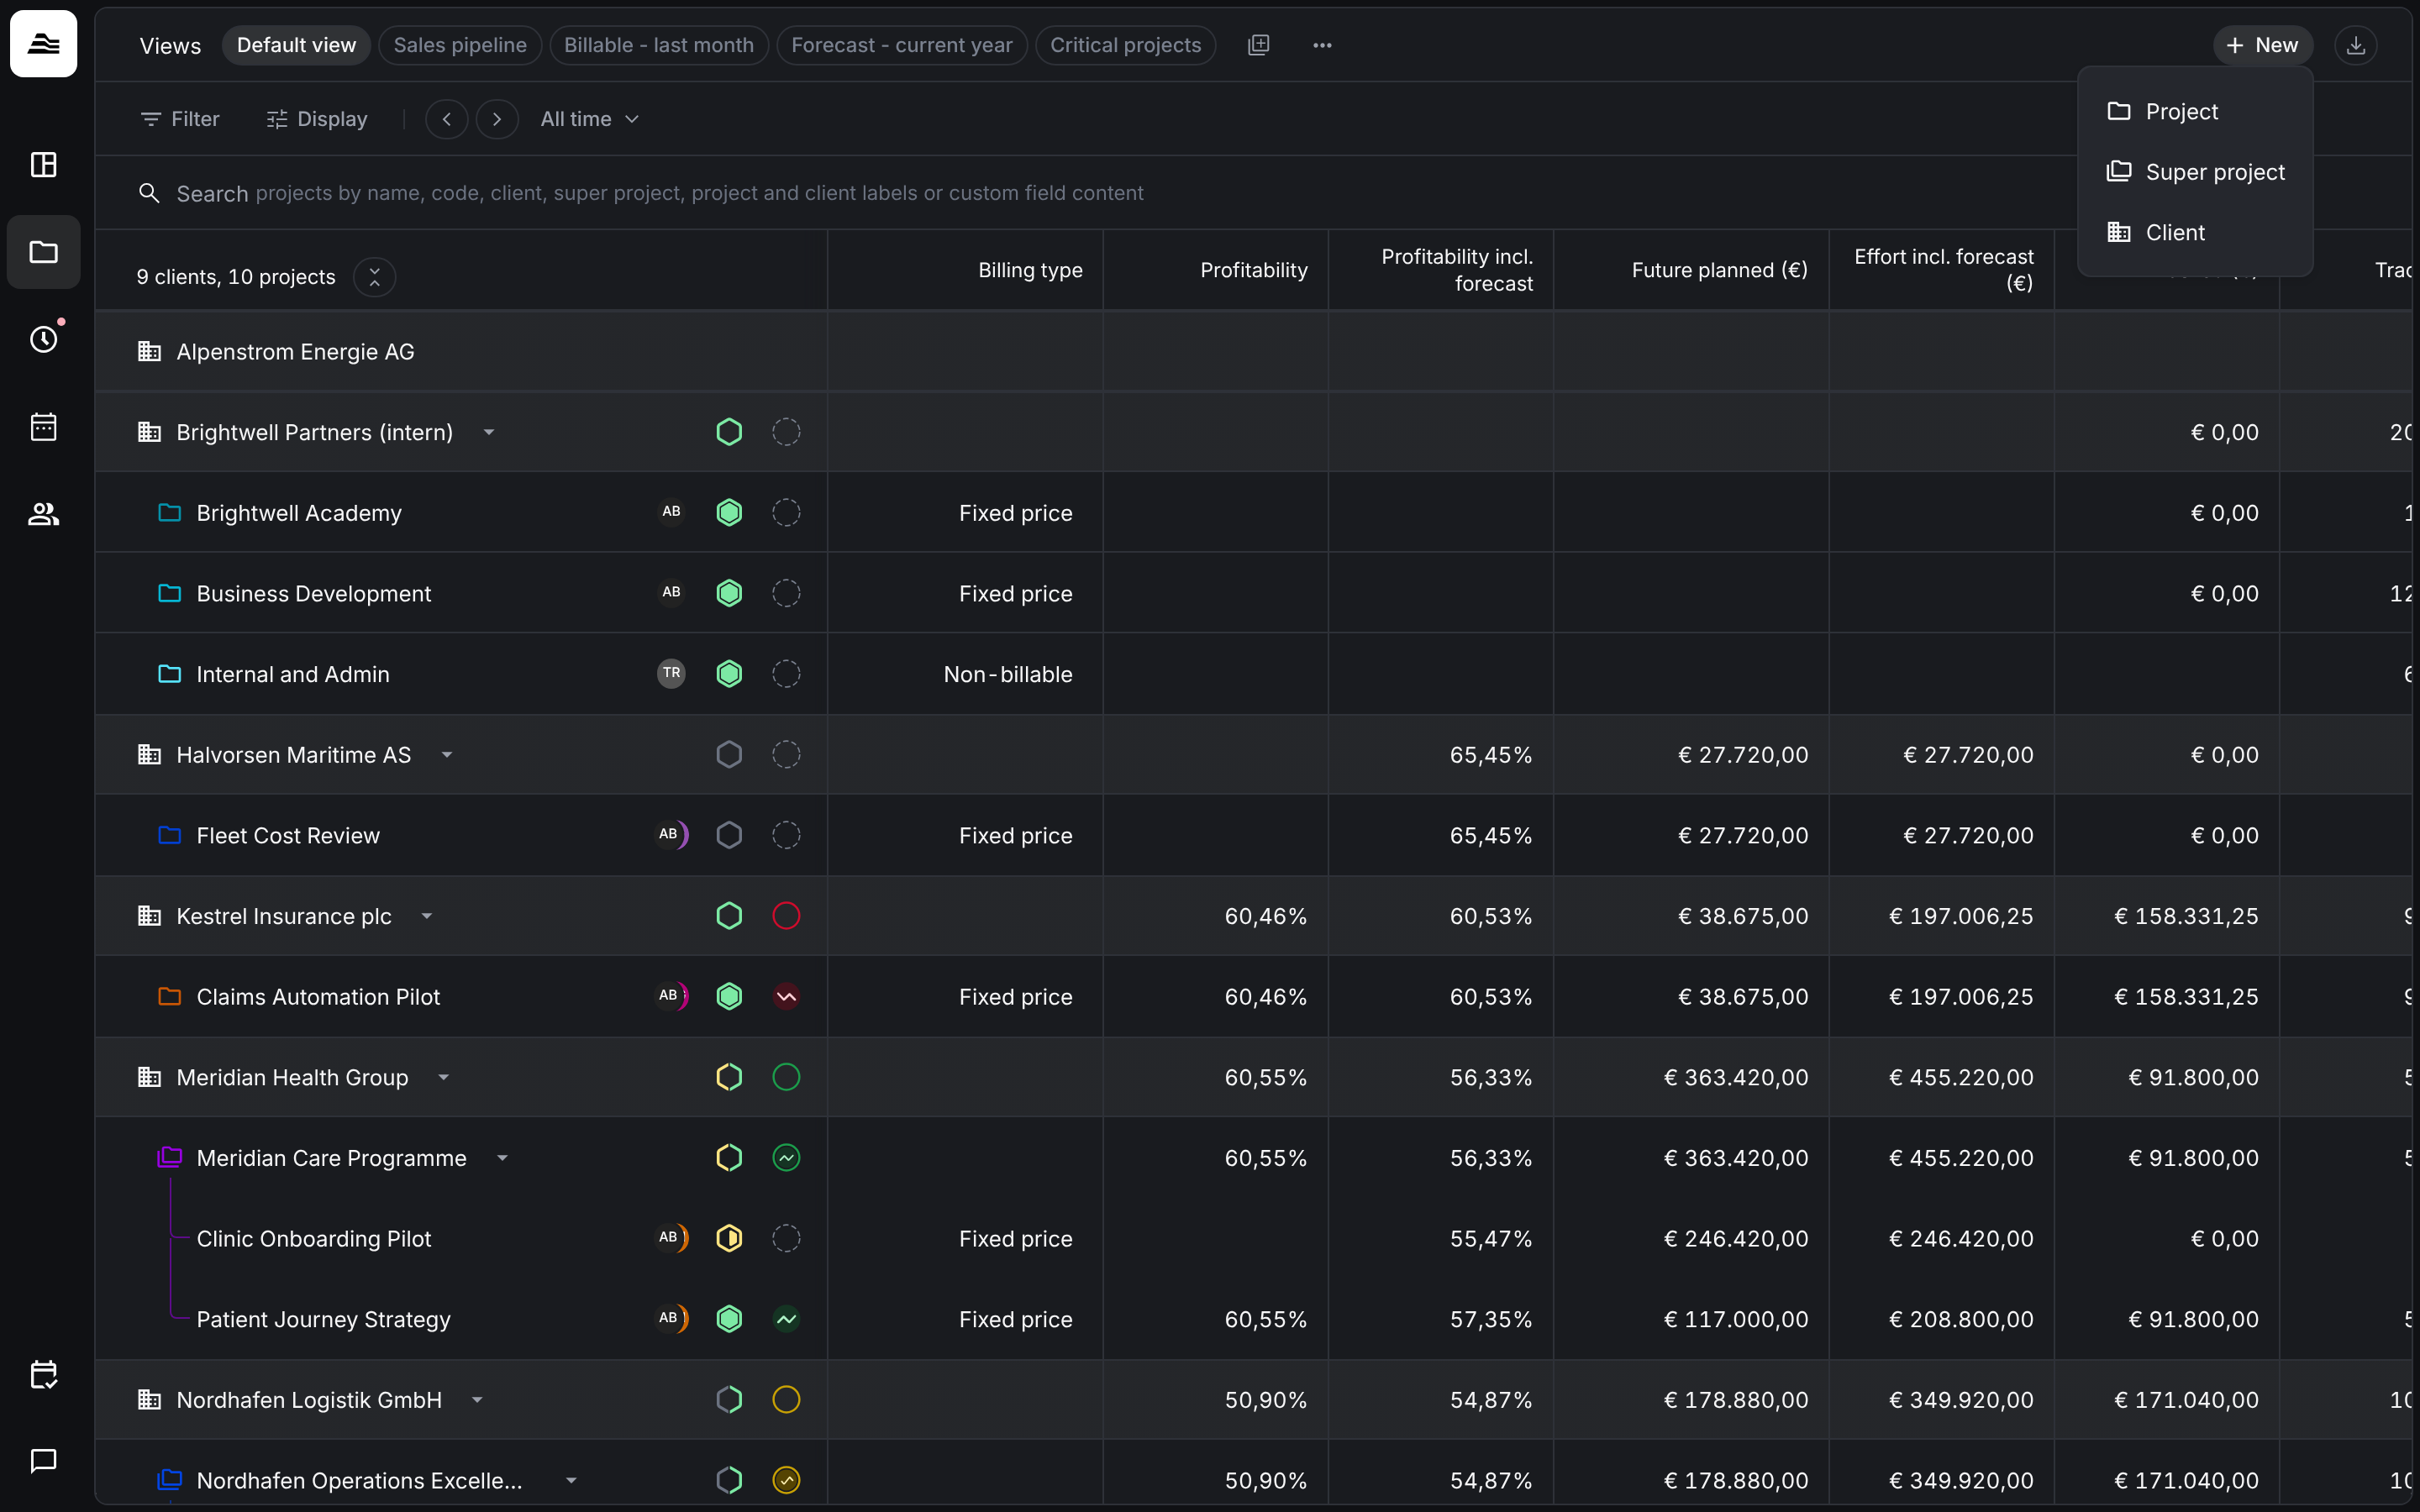
Click New and choose Project, Super project or Client. Aerion creates the new record right away and opens it, so you can fill in the details.
Related
- Project status and health: what the markers mean and how to set them.
- Super projects and sub projects: group several projects of one client.